Story Structure
In this exciting reading, you will learn the importance of identifying story elements from your data.
DIGITAL MARKETINGSOCIAL MEDIA
4/4/20253 min read
Data
storytelling
Data storytelling is the practice of explaining data insights to a specific audience using a clear and compelling narrative. Formulating a story from data is a very important piece of digital marketing. Each time you tell your compelling data story, it should be structured using three elements.
The three-part data story structure
Before you can tell your data story, you will need to analyze the data to determine the story hidden within the data. In data storytelling, always remember that there are three elements to every story: context, complication, and resolution. When you’ve thoroughly analyzed your data to determine each element, you’ll be able to tell the whole story.
Creating context is an important part of storytelling with data, because without context, you have no starting point for your story. Think of your context as the framing of the situation. For example, imagine your company had a decrease in both sales and their customer base last year. The company's goals are to maximize profits and grow their customer base this year. Those goals may be the context of your story.
Context
Complication
Next, you need to identify the complication in your story. This is typically the reason the situation requires action. A complication isn’t always bad, but rather an explanation of how the situation has changed based on your data. For example, if your company’s goals are to maximize profit and grow their customer base, and the data shows you are on track to meet the first goal but not the second one, that is a complication. Any kind of change in metrics would be an example of a complication.
Resolution
Finally, like any story, it should end in a resolution. The resolution of your data story is the necessary action taken to solve a problem or leverage an opportunity. It answers the questions: How did the story end? What were the results of the complication? What do your results tell you about the campaign? For instance, if the results show that you are maximizing your profits but are not driving new customers, explain the data-driven action you will be taking to change that.
Example story
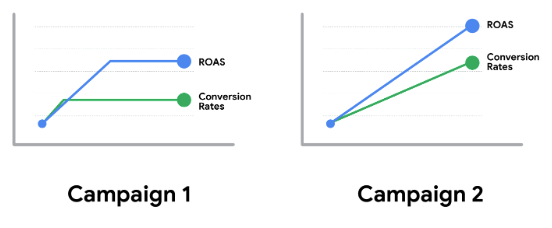
Now, review an example data story. Using the graphs above as a reference image, recall the toy company example from a previous video. Recall that in the video, you measured the results of a new social media campaign for your toy company.
The context of the data story may be your past social media campaign’s performance. In this past campaign, you aimed to increase sales by 5% over a three month period through the use of paid social media ads. Unfortunately, you didn’t reach that goal during your last campaign, and you want to review the data of your current campaign to see if it is performing better. Now, you’ve set the context for this data story.
When you take a look at your past return on ad spend (ROAS) and conversion rates to compare them to this campaign’s numbers, you notice an increase in both ROAS and conversion rates. That increase is the complication of your campaign. Remember that although complication sounds unfavorable, this won’t always be the case.
Finally, the resolution of your campaign tells the story of why ROAS and conversion rates are soaring. Did the ROAS and conversion rates increase because you changed the copy, switched out the images, ran a promotion in your ads, or something else? Your findings are your resolution.
Related Blogs
©2026 Designed To Conquer LLC Terms & Conditions FAQ Private Policy
Designed To Conquer LLC is a NYS MBE Certified Creative Tech. Studio.
STUDIO HOURS
Monday: 10am-6pm
Tuesday:10am-6pm
Wednesday:10am-6pm
Thursday:10am-6pm
Friday:10am-6pm
Get the 5-step checklist we use for every client launch.